Reporting
Office attendance and desk utilisation reporting
Do we need this much space, and is anyone following the policy?
No card, no contract, nothing to install.
Nominated for Office Management Supplier of the Year three years running.
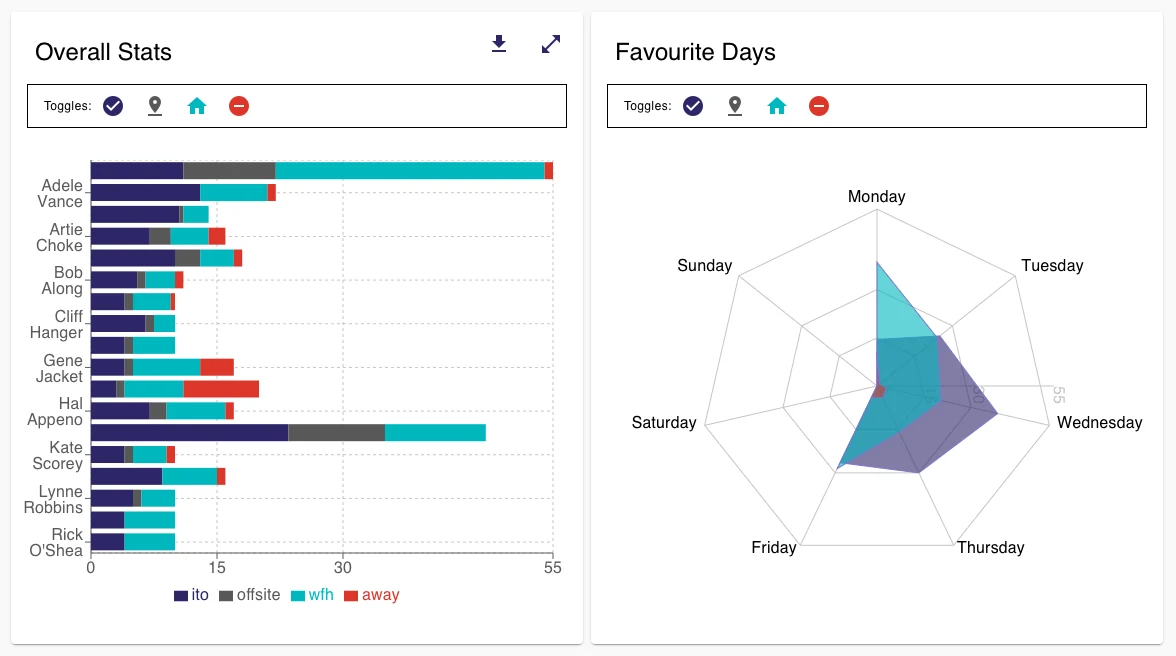
Reporting is the intheOffice module that turns the schedule and the bookings into numbers: attendance by day and by person, office against home against away, desk and room utilisation, and the check-in and check-out log from Scan In, all exportable to CSV. It is for the people sizing the office, checking the policy or reviewing the lease.
What changes on Monday
The space question gets a number
The month shows how full each day was against the capacity you set, so the lease conversation starts from what happened rather than from what people say they intend to do.
You can see the week the office keeps
The busy days and the quiet days are a chart, so the deep clean, the repairs and the work that needs an empty office go where the office is empty.
The policy becomes measurable
Days in the office for each person over any range, so two days a week is a count you can check rather than an impression you argue about.
Rolling it out
Reporting reads the days people have already set, so the first report covers the history the schedule already holds.
What it costs
Reporting is a Premium module; switching it on starts your trial.
There is no published price for Reporting yet: talk to us.
The 7-day trial starts when the first module is switched on, not at signup.
What Creditsafe could not see
Creditsafe adopted hybrid working and then could not see where anyone was. Cardiff already had a desk booking system, but it described the desks and nothing else, which left the data too thin for HR to rely on. intheOffice replaced it across four offices, and HR has the attendance picture it was missing.
What can you do in Reporting?
Do we need this much space?
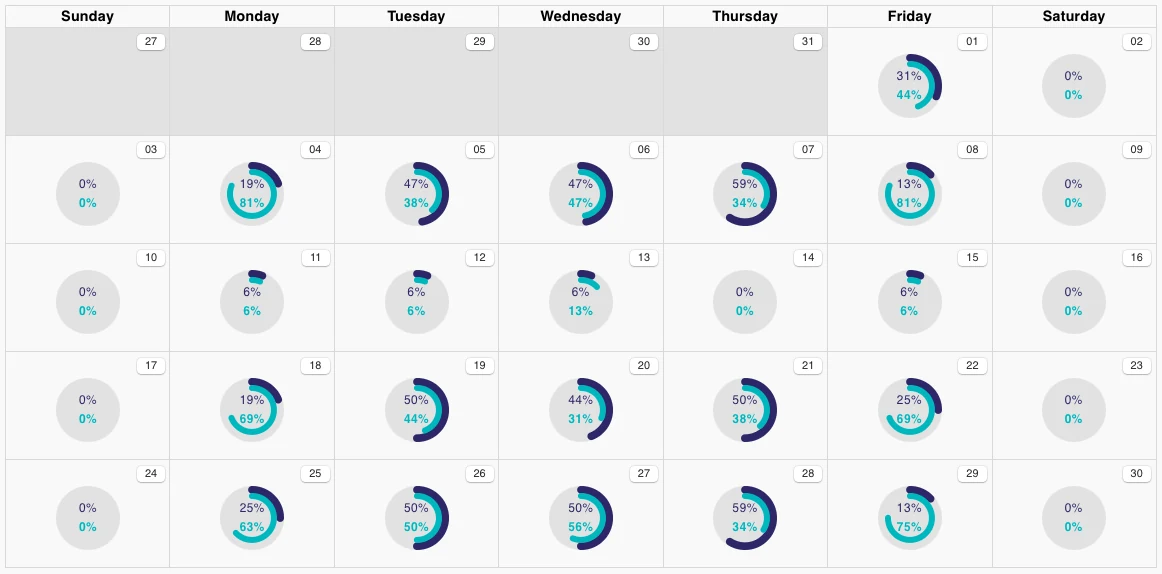
The Location view draws the month as a calendar and puts a gauge on every day: how much of your capacity was in the office, and how much of it was working from home. Page back through any month since you started and the full weeks and the empty ones are in the same picture. Capacity is the number you set for that office, as a headcount, a percentage or the number of desks, so utilisation is measured against the room you actually have.
Is anyone following the policy?
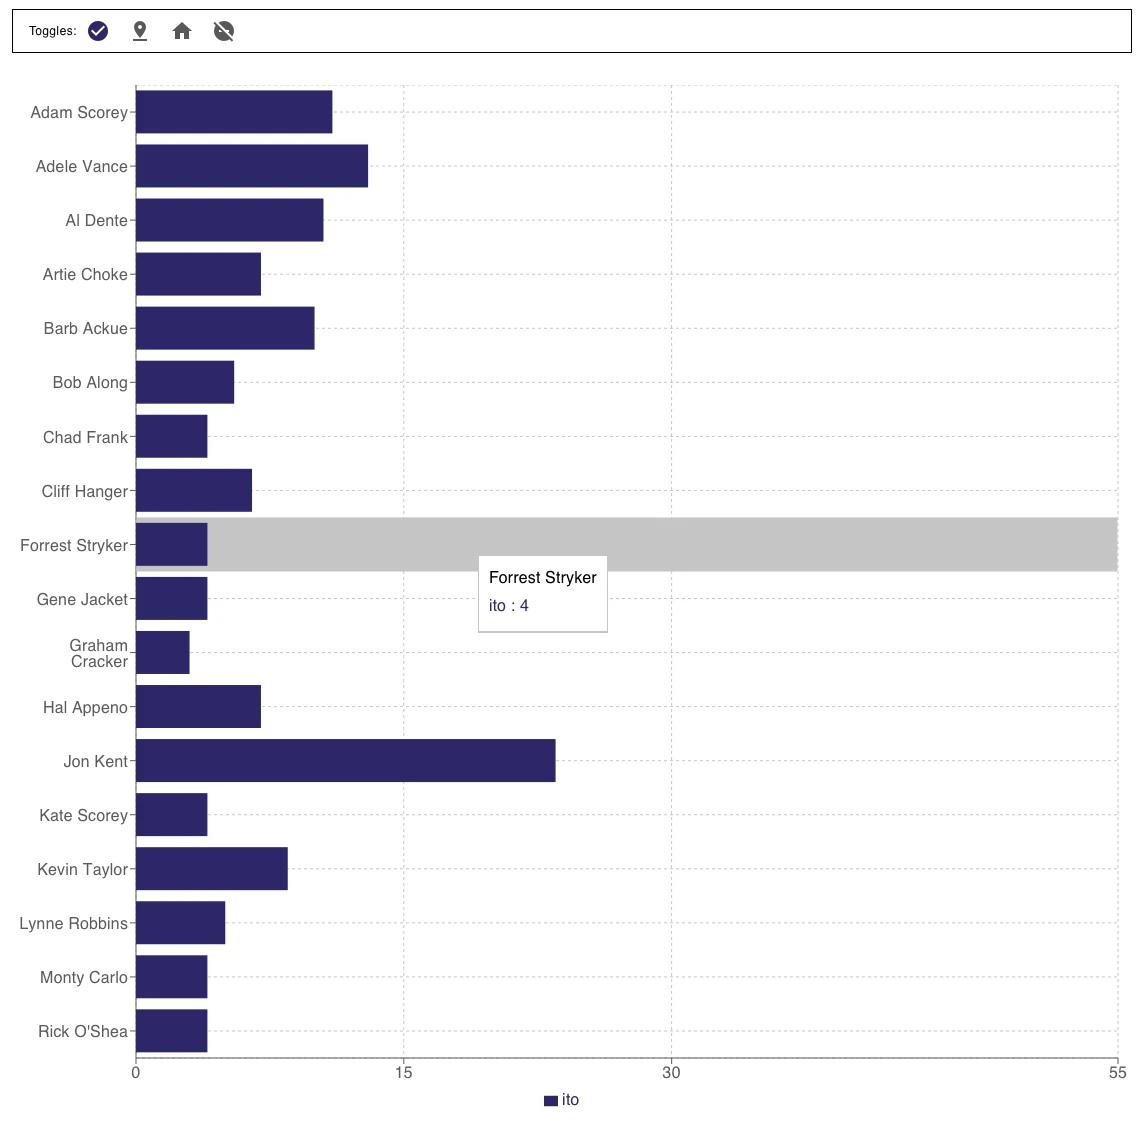
Days in the office for each person over the range you choose, one bar each, with the count shown when you point at it. A policy of two days a week stops being an impression and becomes a number, for the office you are looking at.
Peak days and quiet days
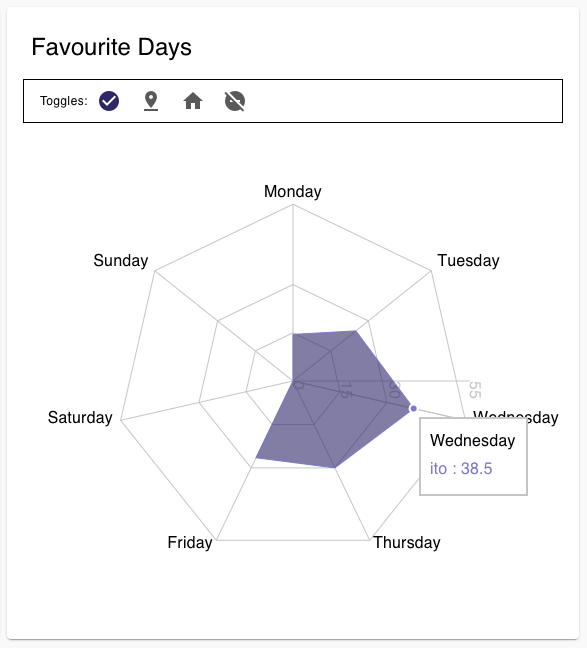
Favourite Days draws the week as a seven-sided chart, one point for each day. It tells you which days the office fills, so you can size it for the busy day rather than for the average, and which days it is empty, which is when the repairs, the deep clean and the quiet project work should go in.
Three exports
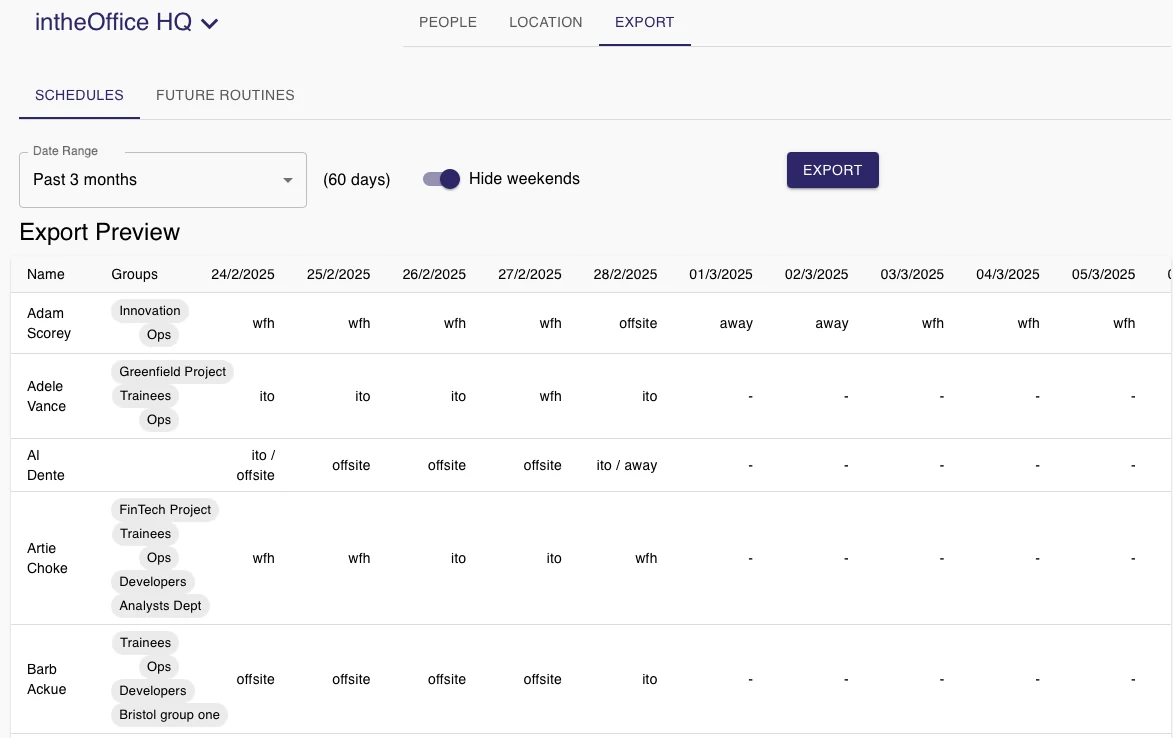
Schedules, the historical attendance record. Future Routines, what the office is expected to look like from everyone's Routines, which appears once Advanced Scheduling is on. The check-in and check-out log, every arrival and departure with the name, the date, the time, the action and the location, for the people and the dates you pick. Choose a range, hide the weekend, read the preview, then export.
A report you can send on
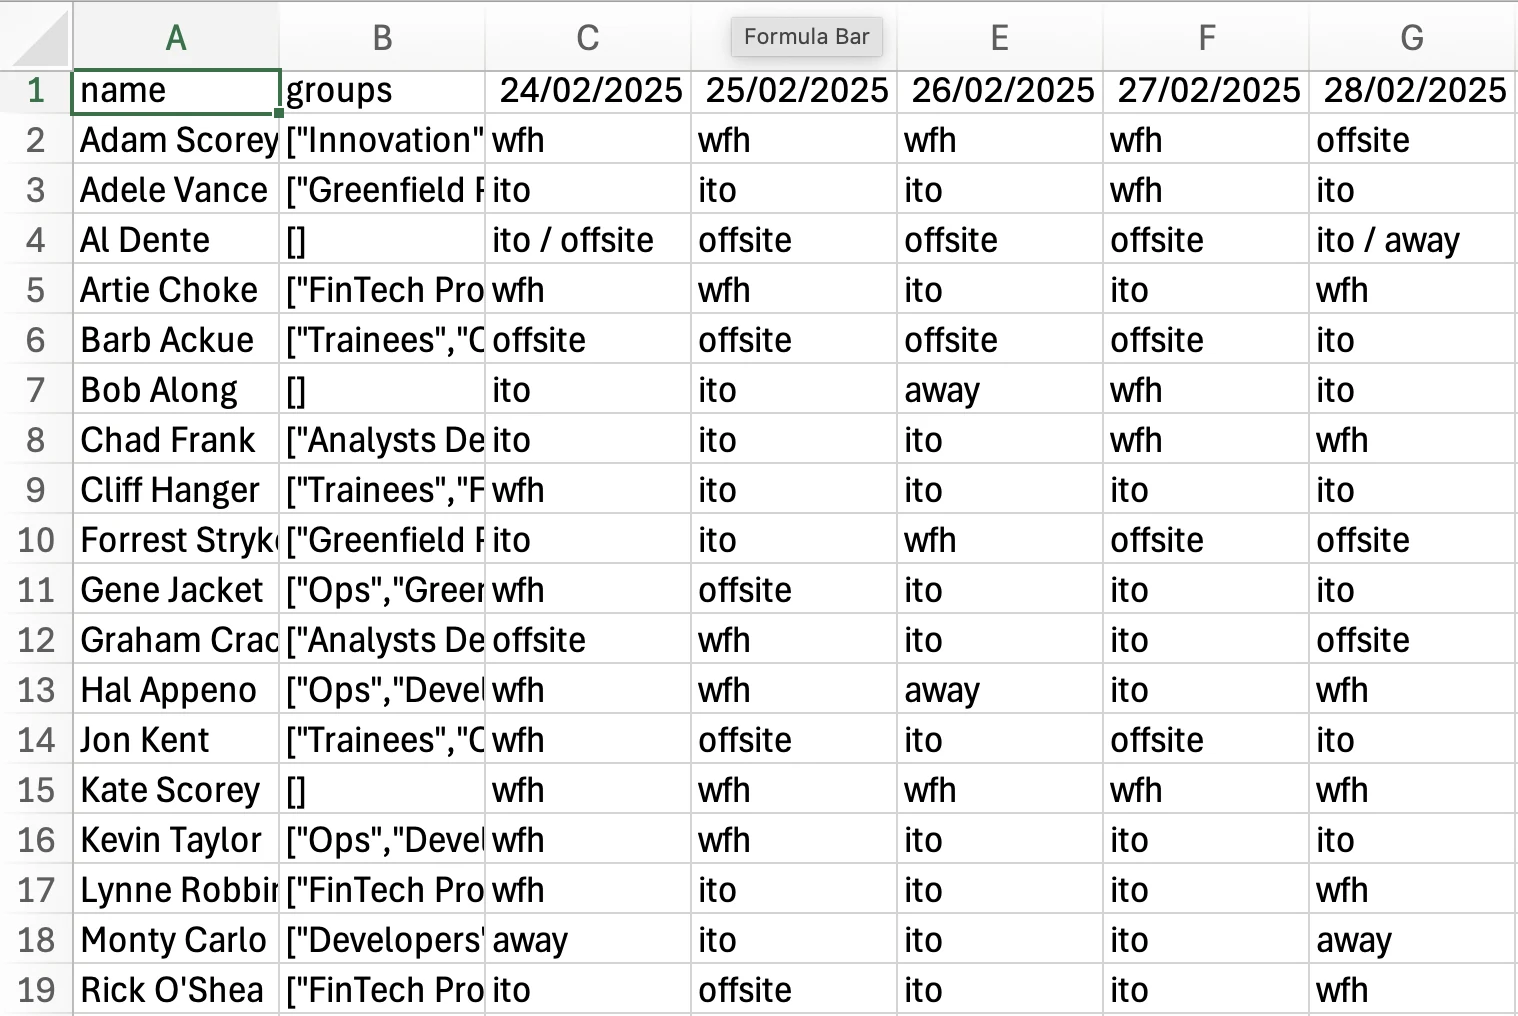
Every export is a CSV: one row for each person, one column for each date, and their status in the cell. It opens in a spreadsheet and goes into a board pack or a lease review as it is. Every chart on the screen has a download beside it too, so the numbers behind the picture come out with it.
Attendance patterns over any date range
The People view stacks everyone's days as in the office, offsite, working from home and away. Choose the last week, anything up to the past six weeks, or your own dates, hide the weekend, and switch each status on and off to read one of them at a time.
Planned against actual
The schedule and the Routines say who meant to be in. The check-in and check-out log says who walked through the door, from the code people scan at the entrance. The gap between the two is a number no survey will give you.
Per location, and admin only
Reporting is switched on one office at a time, and every view reads for the office picked at the top of the page, so several sites are compared one by one. It is an admin page: the people on the schedule never see it.
A worked example: taking the CSV to a lease review
Illustrative. The numbers below are made up to show the shape of the argument, not a customer result.
What the export showed
An office with 120 desks. Over three months the busiest day was a Wednesday with 68 desks in use, the average day was 41, and Monday and Friday never went above 24.
What the gap added
Routines said 55 people planned to be in on a Thursday. The check-in and check-out log said 44 arrived. Planned attendance and actual attendance are different numbers, and only one of them is evidence.
What went into the review
Three exports and two charts, and a case for a floor sized for the busy day instead of for the headcount. The people who sign the lease and the invoice have a page of their own.
Frequently asked questions
Can we see how many desks we actually need?
Yes. Reporting shows attendance by day and desk utilisation over any range, so you can see the busiest day, the average, and how many desks sit empty.
Can we export it?
Everything exports to CSV: attendance by person, by location, and the check-in and check-out log.
Is this monitoring?
It records the status each person set and, if people scan in at the door, when they arrived. It does not track where people are during the day or what they do, and it is an admin page, so colleagues do not read each other's reports.
Tell your people what is recorded and why.
More products from intheOffice

No card, no contract, nothing to install.